Turning Operations Data Into Actionable Insights
Managing multiple cleaning contracts often feels like you are constantly putting out fires. Without a clear way to track how your services are performing across different sites, it is easy to miss subtle issues before they turn into major complaints.
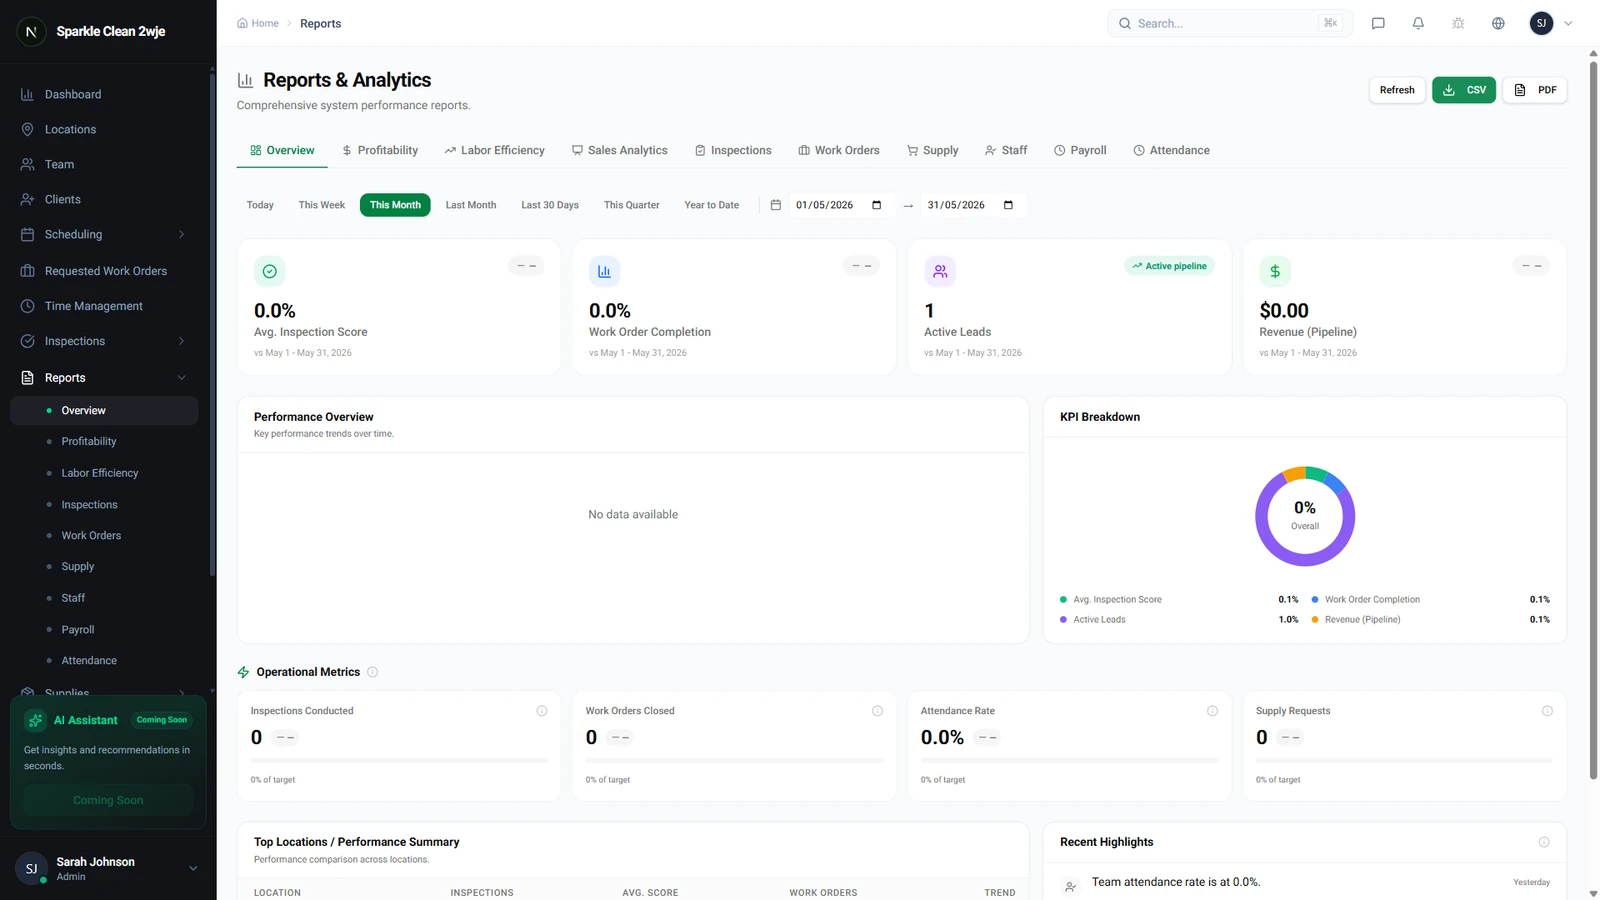
CleanTrack360 provides the tools you need to shift from reactive management to proactive improvement. By analyzing quality score trends, you can move away from guesswork and start making decisions based on actual performance data.
The Challenge of Maintaining Consistency
Even with a dedicated team, maintaining a high standard of cleanliness across all your locations can be difficult. Common operational hurdles often impact your ability to deliver consistent results:
- Hidden performance dips: Minor drops in service quality can go unnoticed until a client brings them to your attention.
- Resource allocation issues: It can be difficult to tell if a dip in quality is due to poor team performance, a lack of supplies, or simply the need for better training.
- Team morale: Without clear feedback, it is difficult to know when your team is doing a great job or when they are feeling burnt out.
How CleanTrack360 Quality Trends Work
Reading and Analyzing Trends
The Quality Trends feature within your reports shows you exactly how quality scores change over time across your various locations. The trend graph allows you to visualize performance, where an upward trend signals consistent improvement in your service delivery.
Consistent scores above 90% act as a key indicator that your quality program is well-managed. Monitoring these levels gives you the confidence that your standards are being met site-wide.
Acting on Your Data
When you spot a downward trend, you can investigate the root cause immediately rather than waiting for a client to report an issue. Declining scores can point to specific operational needs, such as the requirement for extra team training, a shortage of essential cleaning supplies, or general team fatigue.
Getting Started With Your Data
You can access your performance data directly through the reports section of your CleanTrack360 dashboard. Start by reviewing the trends for your various locations to see which sites are excelling and which ones may need extra support.
If you have questions or run into technical issues while analyzing your data, the Support section in your dashboard is available to help you navigate the system. Consistent use of these reports will help you refine your operations and maintain high client satisfaction.