Quality Reports
Understanding Quality Score Trends
Track quality changes over time.
Last updated June 10, 2026
Trend analysis helps you spot patterns and make data-driven decisions.
1
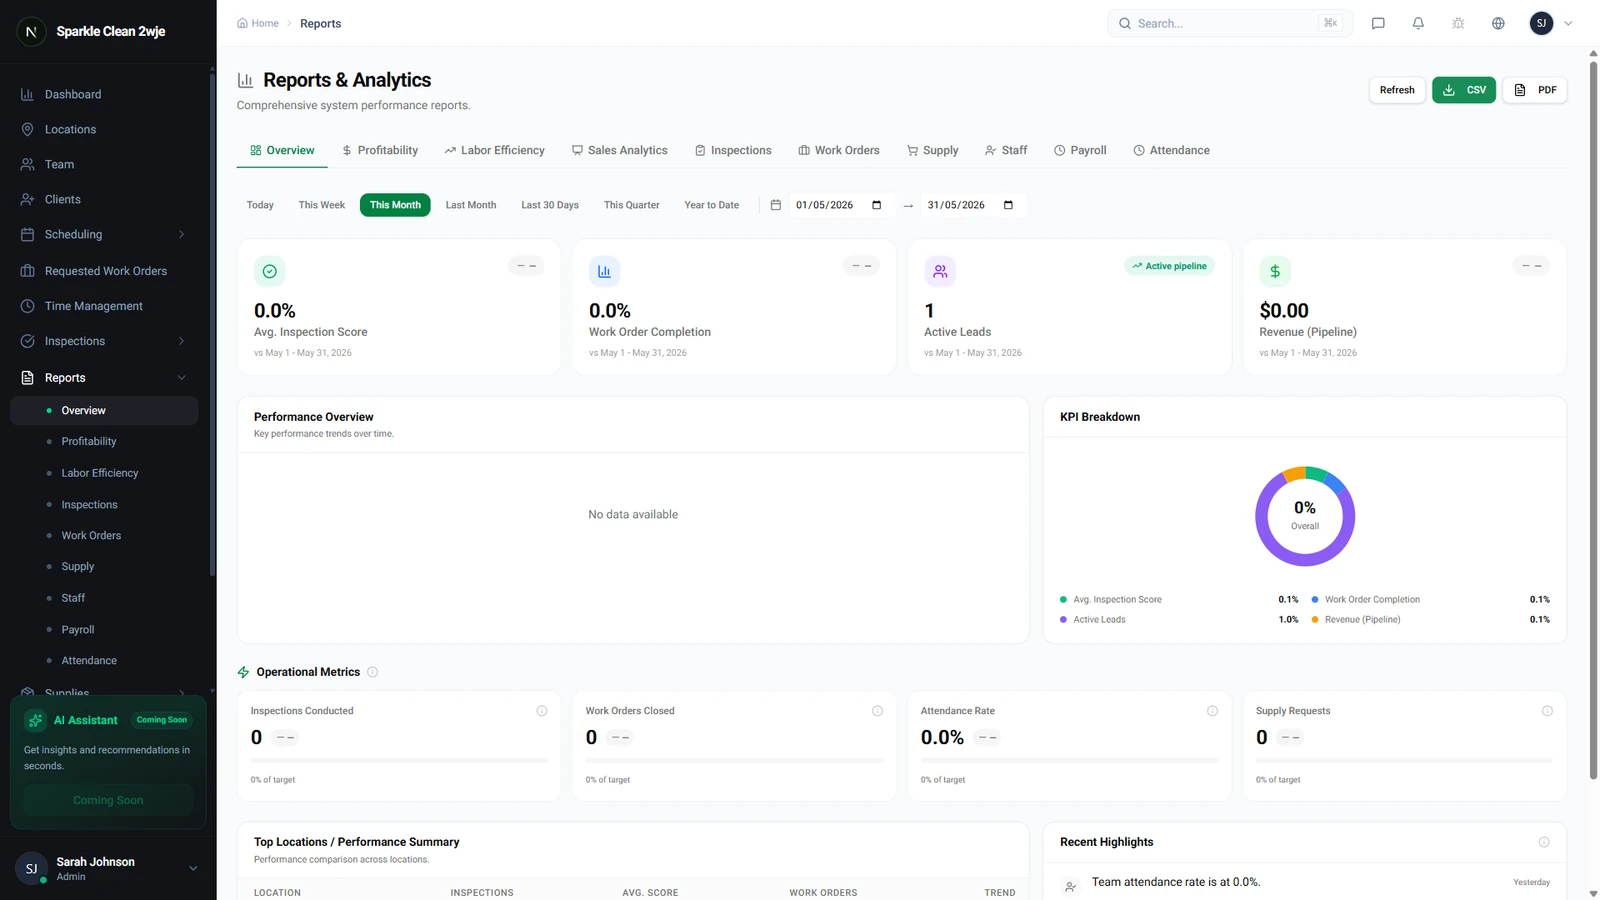
Quality Score Trends
In Reports, quality trends show how scores change over time.
2
Reading Trends
The trend chart shows average quality scores over time per location. Upward trends = improving quality.
ℹ️
Consistent scores above 90% indicate a well-run quality program.
3
Act on Trends
Declining trends may indicate: need for retraining, insufficient supplies, or team fatigue. Address root causes promptly.
💡
Pro tip: Share positive trend reports with your team as motivation!
🙌
Need help? If you have any questions or run into issues, reach out through the Support section in your dashboard.